LYNX TRACE
All test data, manufacturing figures and statistics for process analysis in a single application
Lynx Trace is a cloud software that implements three main qualities of a test software: DDBB storage, traceability, and statistics. It unifies in a single portal all test information generated by the Lynx Scheduler at the company manufacturing plants. It features relevant test information for plant managers for the evaluation and optimization of the implemented test process by showing configurable statistics, plant time and performance comparisons. It also implements DUT returns and rework handling.
OUR
TEST
SOLUTIONS
ALREADY
BENEFIT


Storage of real test data
Alarms
Global Traceability
Statistics
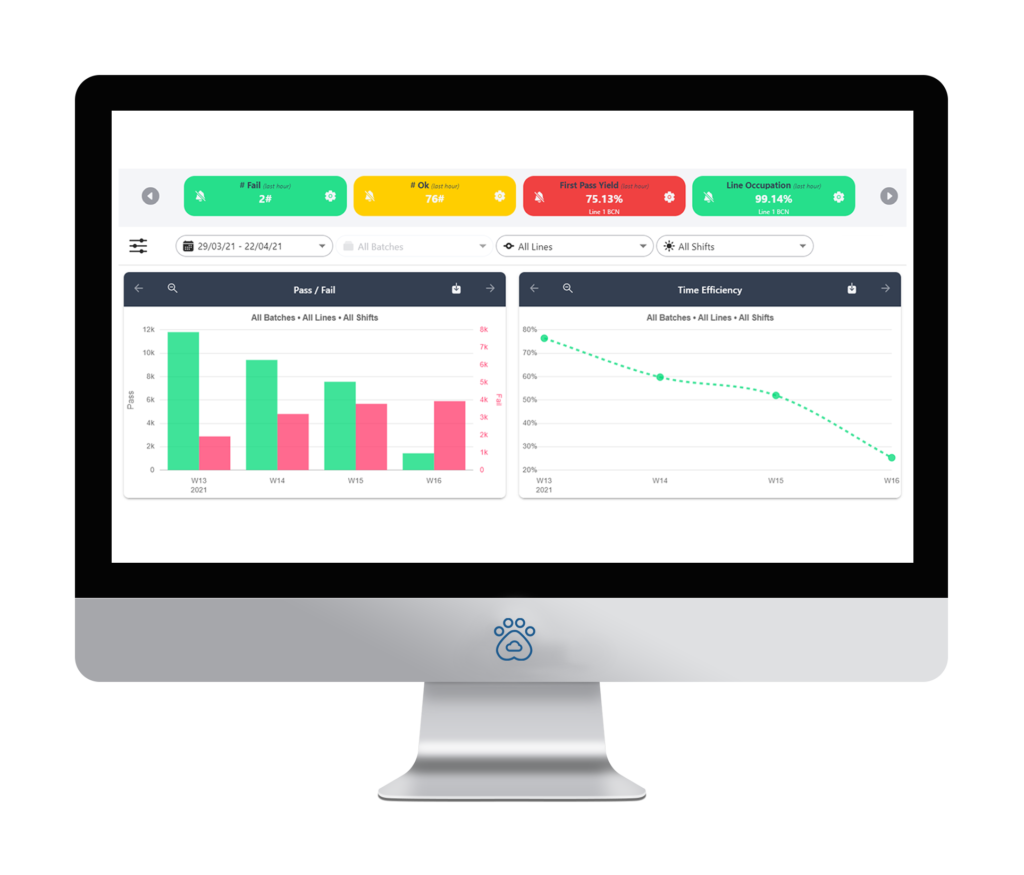
KPIs
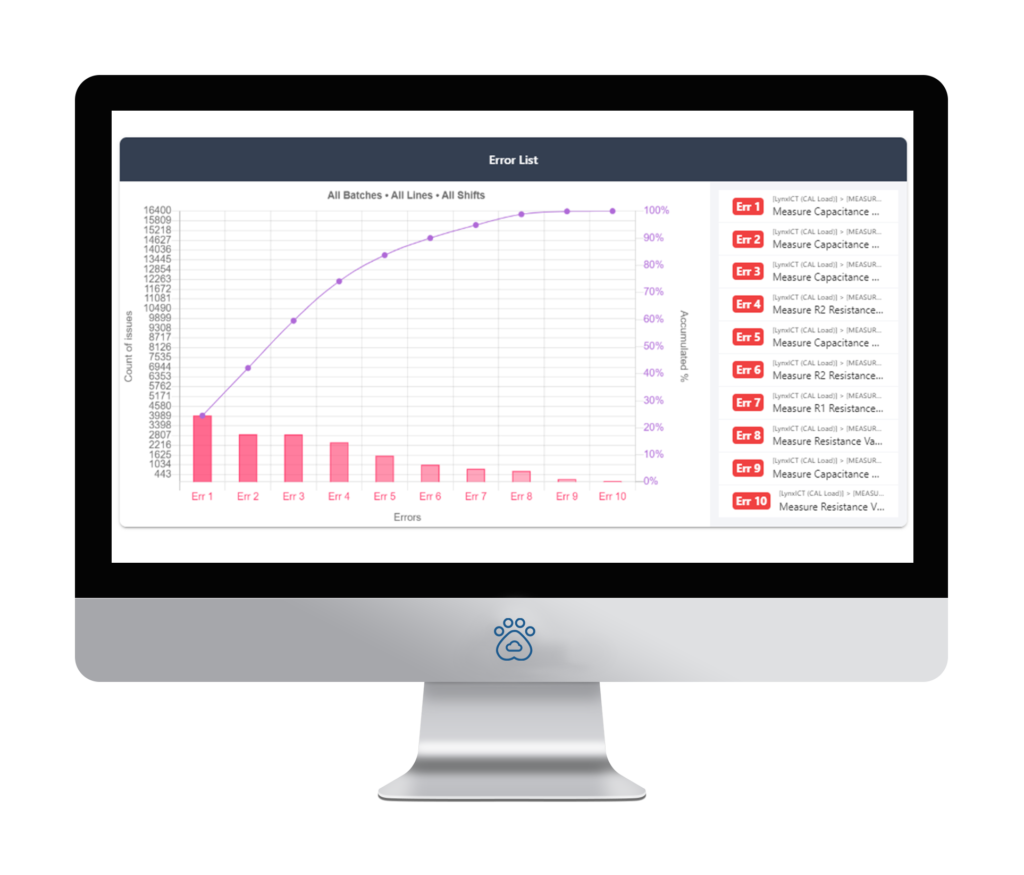
Error frequency chart
Storage of real test data
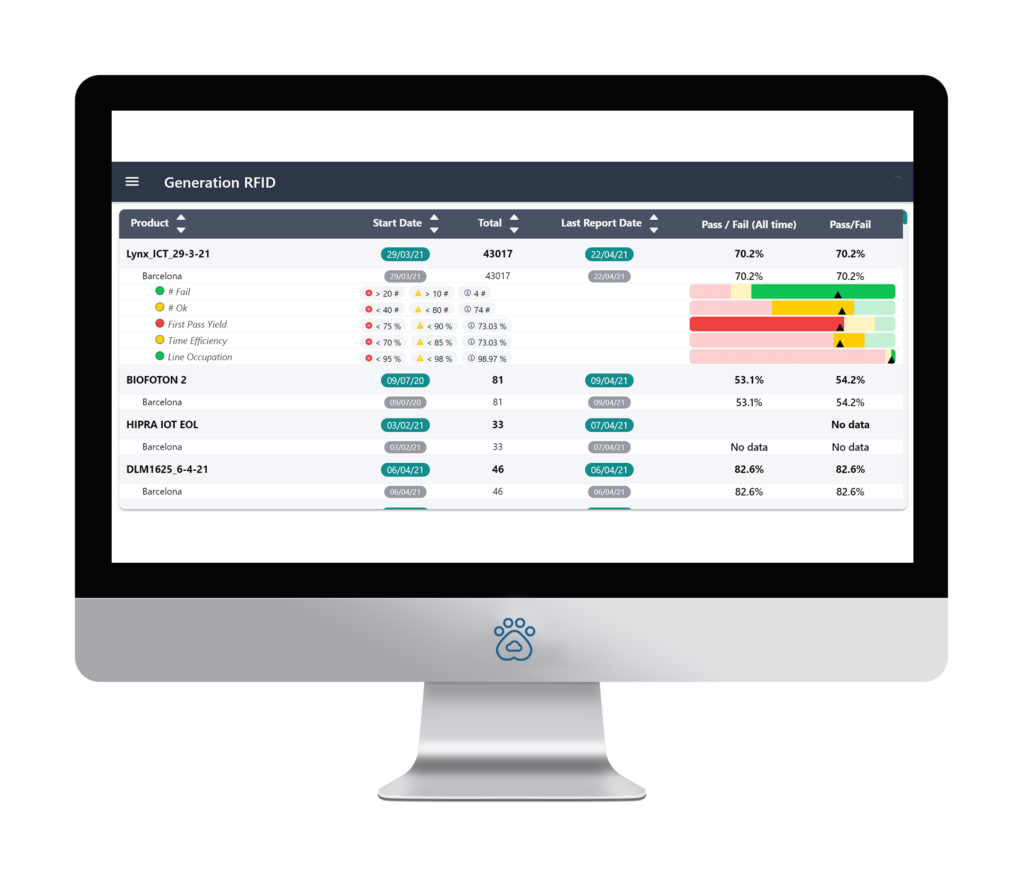
Lynx Trace is a common webpage where test data is centralized for a quick view of the test process figures. It is, therefore, the reference site where the user can consult the information of the production data results. It is useful for managers and test engineers. In order to help daily activities, it shows information such as product, manufacturing line, activated KPI, alarms, number of tests, dates and test hit rate.
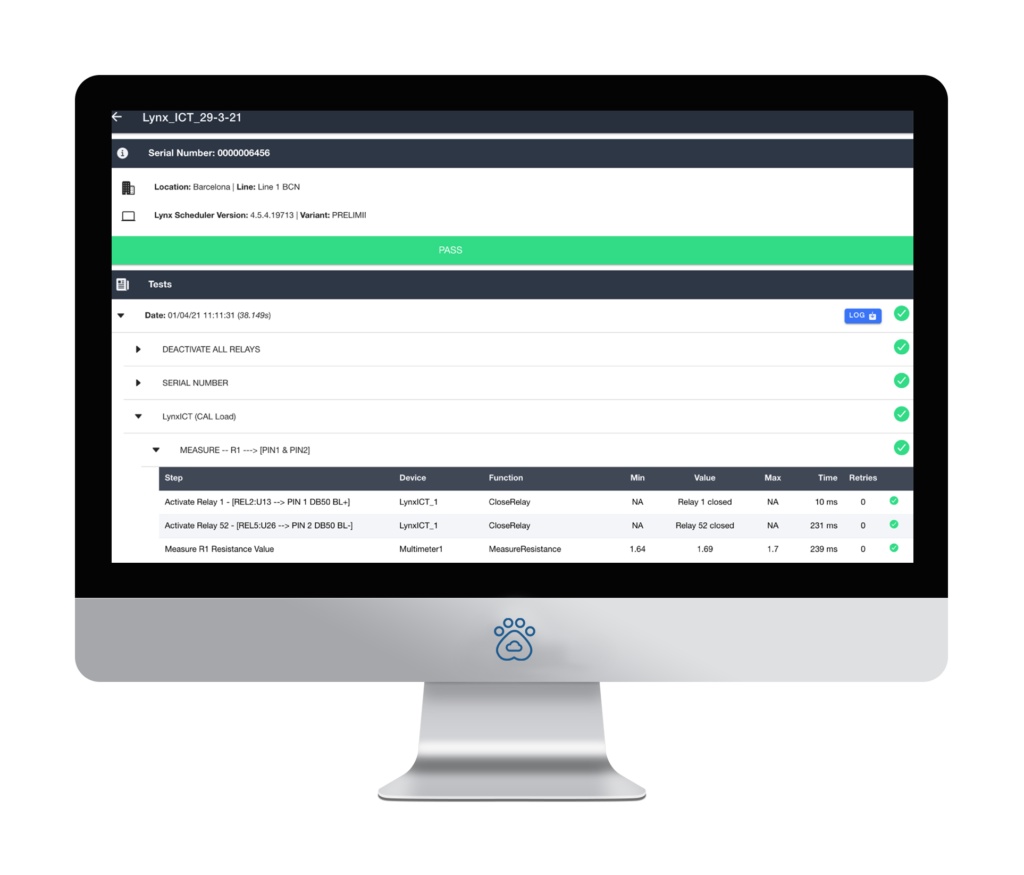
Global Traceability
Traceability is the basis of manufacturing control. Lynx Trace incorporates unitary traceability to associate each DUT with its test results. With this solution, you will never doubt anymore whether a product is correct or not, since you can check the validity of the results of the tested DUT from anywhere. It also includes features to help rework engineers, such as filters to show only parts that are NOK.
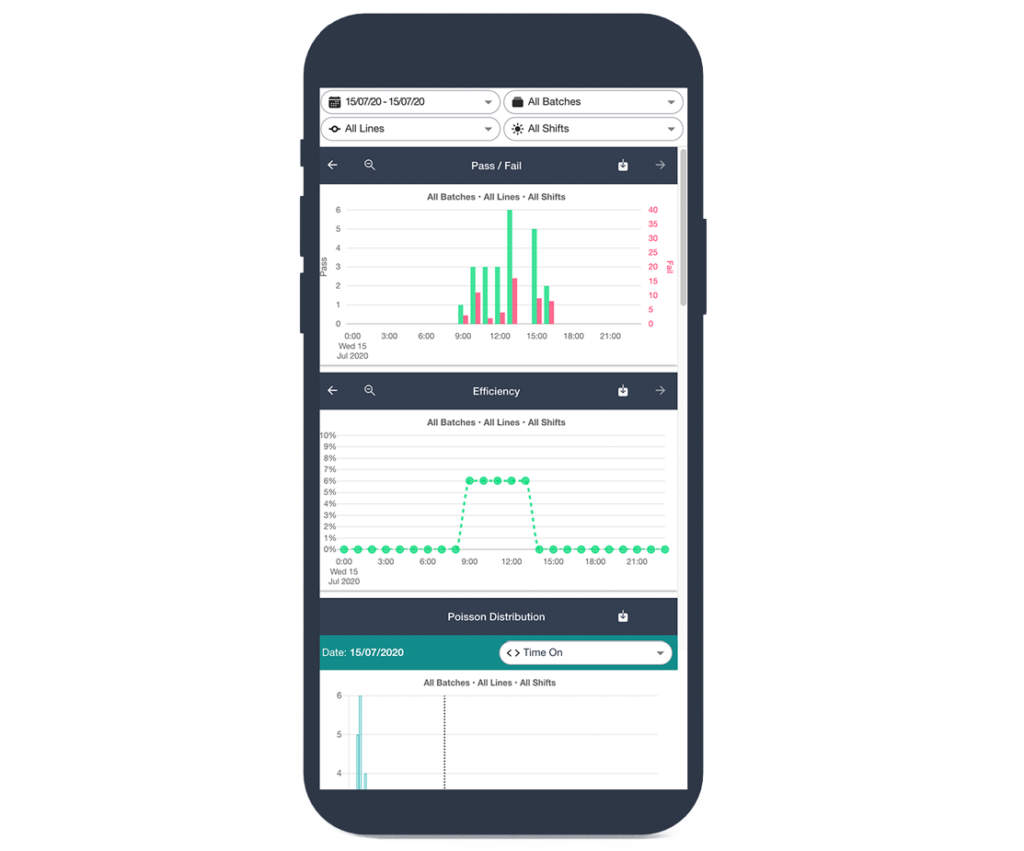
KPIs
Key performance indicators, commonly known as KPI, are figures that give relevant information about the effectiveness of the test process. Values such as manufacturing efficiency, number of OK or NOK parts, First Pass Yield or Line Occupation are available for each product tested in the manufacturing line. It allows a comparison between the performance of different manufacturing plants.

Alarms
Linked to the KPI, Lynx Trace can set up alarms to alert the test engineer that there are inefficiencies in the manufacturing line related to the product testing, so that corrective measures can be applied immediately. These are user configurable, so they can be adapted to the necessities of each product or company.
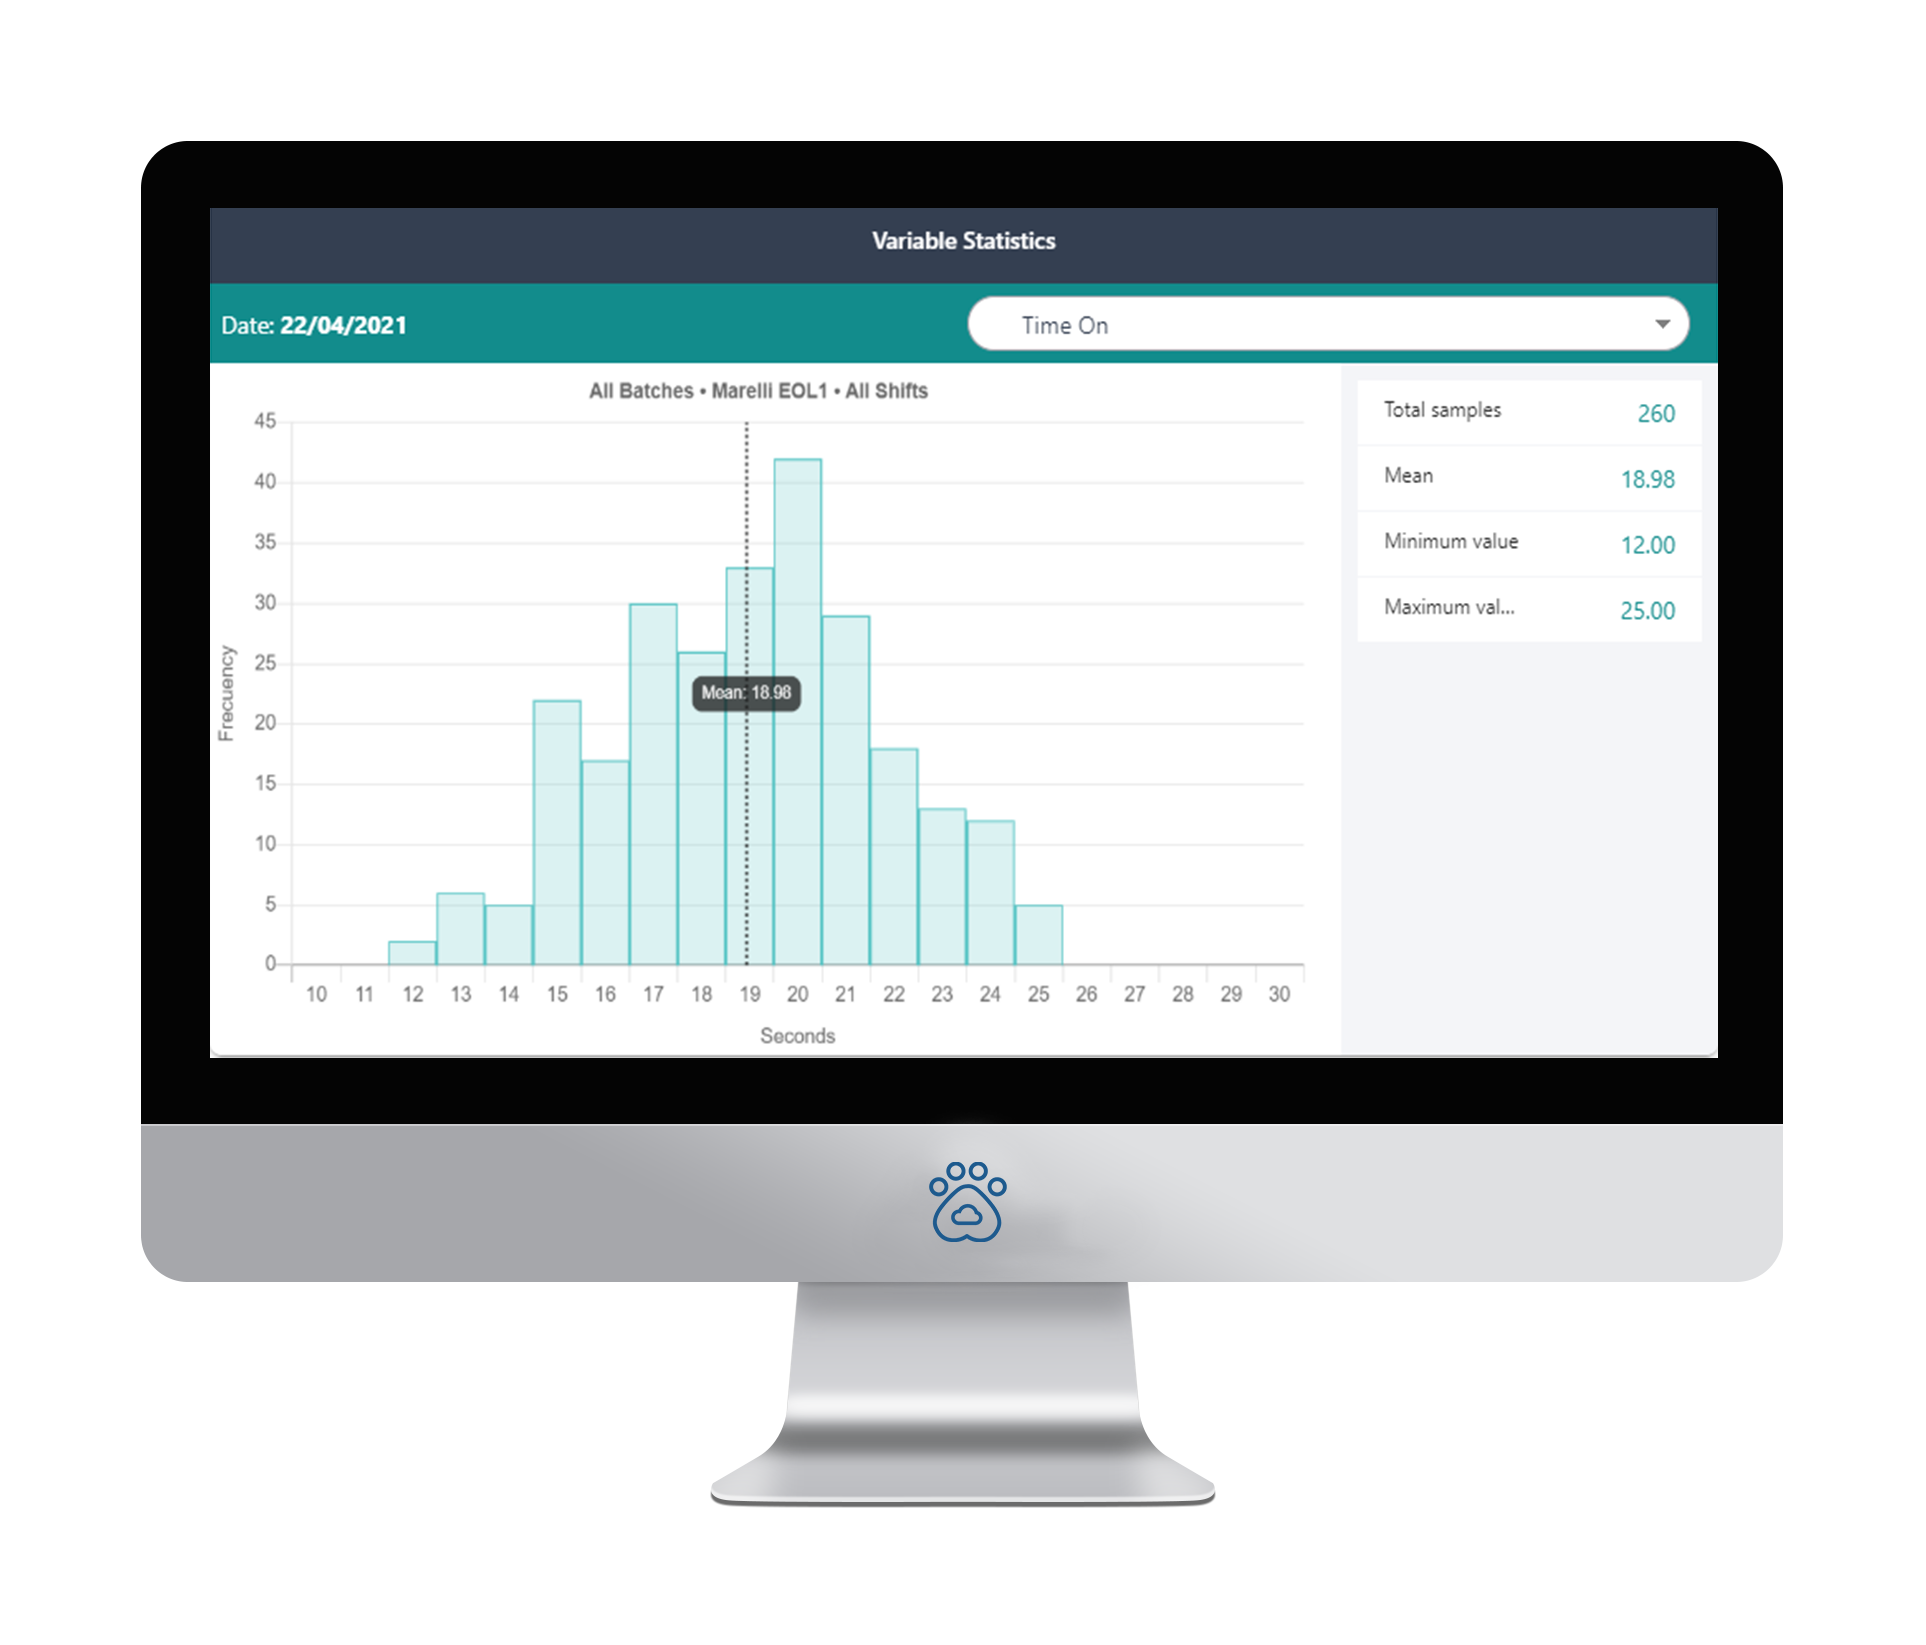
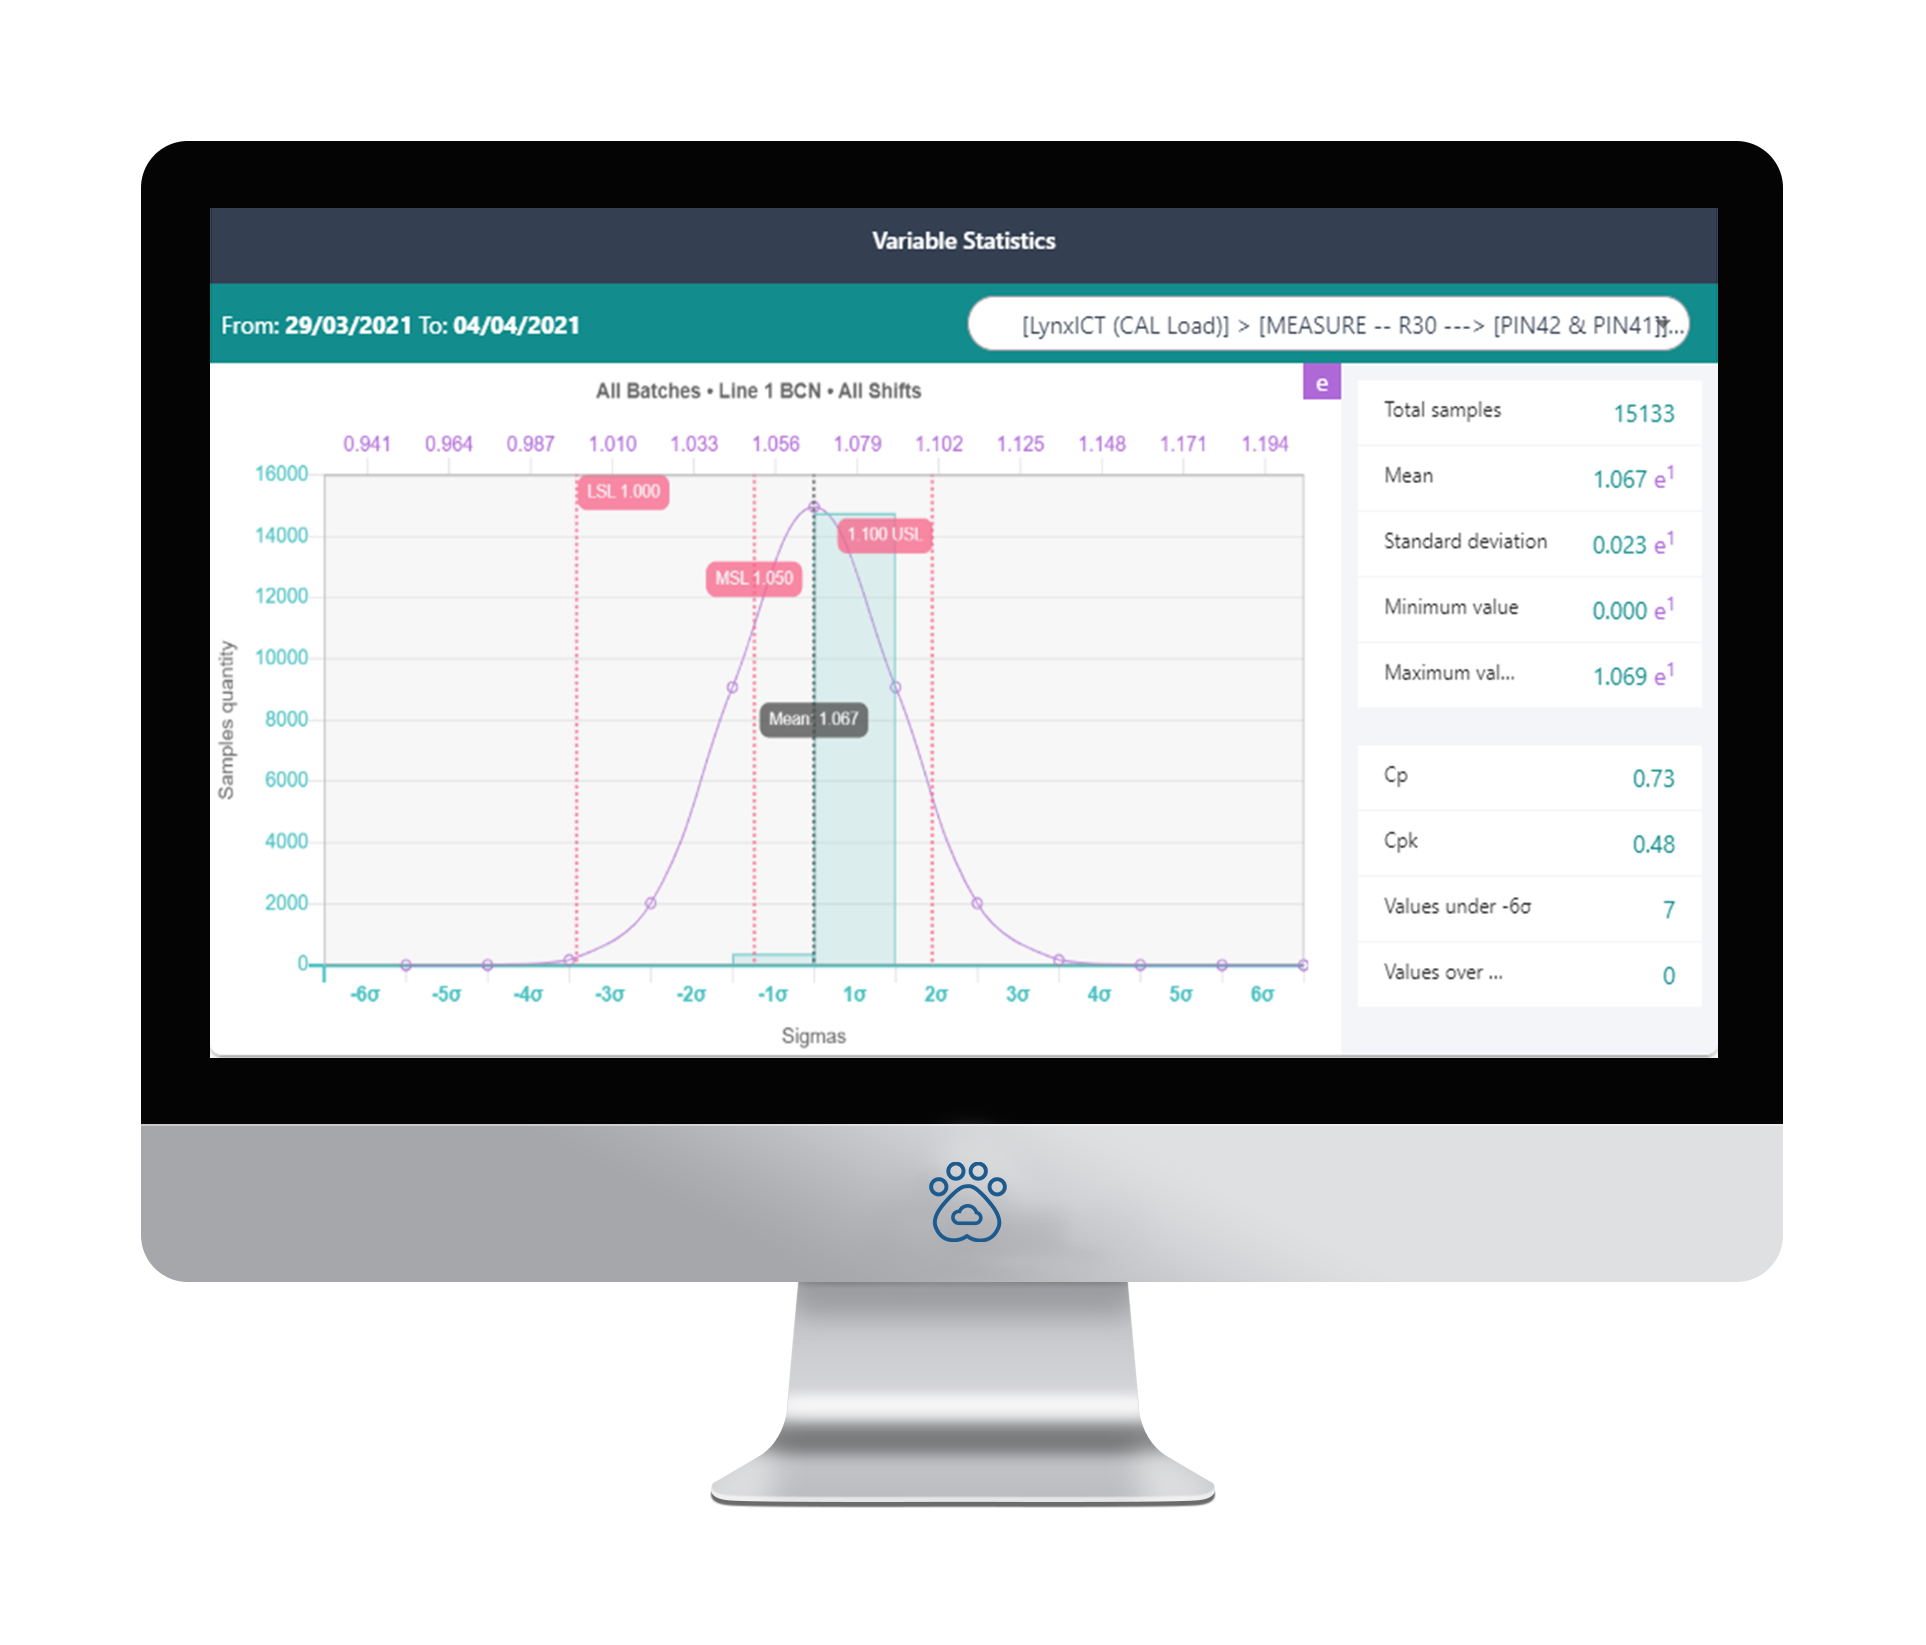
Statistics
Centralizing and operating in cloud data allows a quick detection of deviations or inefficiencies in the test measured figures. Results are grouped in variables among all tests performed and are analyzed in a statistical way to make the correct decisions. For the variables that follow a normal distribution, such as those measured with a DMM. This statistical tool calculates its mean value, standard deviation, or capacity. For time analysis, a histogram is the basis. It is the indispensable tool to detect improvement opportunities and correct them early that allows to increase competitivity. It also can be used to detect whether the electronic design is overengineered, due to it performing much better than what the customer requirements specify.